Results

WOC 2011 Training Camp 1

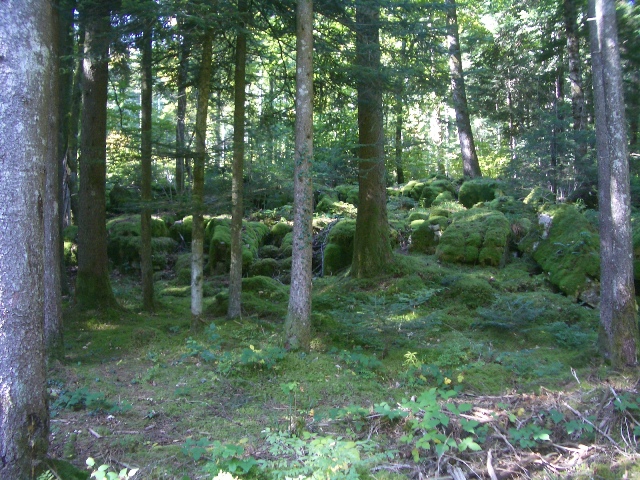
Traditionally team SA arrives a week early before the World Orienteering Champs (WOC) and uses the opportunity to familiarise themselves with the terrain and maps particular to that area.  Whilst such preparation is essential, the benefits of beginning that preparation a year earlier are numerous, as shall be explained below.

The necessity of pre-WOC training
Mapping is like painting. Each artist (or mapper) has their own unique style of painting the picture, of interpreting terrain, and putting it onto a canvas.  WOC preparation must therefore include running on maps made of the area by the WOC mapper.  This allows the orienteer the opportunity to get into the mind of the mapper; to allow an easy flow and understanding; to be able to read from map to terrain and visa versa.

Each WOC area has its own unique features that are key for ones navigation technique.  In some areas it will be marshes, in others depressions.  The orienteer needs to know what the unique aspects are, and then to practice using them.  It is not by chance that in WOC 2010 in Norway several Norwegians took gold medals, with a similar pattern in the Czech Republic the year before.

October 2010 France training camp
A year before WOC 2011 the organisers arranged their first training camp in the area.  The camp consisted of 6 days of training, broken in the middle by a weekend of 3 competition events.  It was also possible to move across to Geneva the next weekend for two more competitions (one in fact just below the WOC 2012 terrain).  The attendance at that camp by a number of SA National Squad members (Tania Wimberley, Nico van Hoepen and Cindy van Zyl) provided the following benefits that would normally be obtained during the training camp the week before WOC:

  1. Ability to run on areas mapped by the WOC mapper.
  2. Ability to run in areas next to WOC areas.
  3. Ability to test techniques unique to that area.

Doing the training a year in advance brought the following benefits:

  1. The organisers were focussed on training, not WOC.  As such they were more accessible for discussion and open to providing insight into mapping techniques and expectations of terrain.
  2. The touring SA squad members did not have to take turns planning the training (and setting out controls) as they had in the past – this was all done for them.
  3. There were 19 other countries at the training camp.  The teams were in training mode, not WOC mode and were therefore open to discussion and sharing ideas. The internet and blog sites also provided insight into other teams thoughts, again unlikely to happen in the week before WOC.
  4. There was a competition during the training week and so we were able to get race experience.
  5. With the benefits of GPS tacking we could see what the top guys were doing in the competitions in the terrain, what techniques they were using.  But added to that we then got to run in the same terrain and directly share in the experiences.
  6. Team SA’s traditional approach of having a pre WOC week of training happens for logistical reasons – cost of flying to Europe and ability to get leave.  It does however, have a big disadvantage in that the team is not tapering their training in anticipation of the competition.  Hence the team does not go into the competition with fresh legs.  Doing the training a year in advance overcomes this disadvantage.
  7. In France we gained insight into how out of date the old maps, currently published on the WOC website, really are.  We had been using these maps in some pre-France preparation, using them for route choice simulations.  None of the expectations built-up during this arm-chair exercise materialised and visiting the area showed that we needed a new approach, which can now be refined over the next year.
  8. The French terrain is more physically tough than had been expected.  Again, with this insight, physical training programs can now be developed to address this aspect.
  9. Mental preparation is always key for orienteering.  Trying to familiarise oneself with terrain a week before a competition is rushed and not ideal.  Visiting it a year in advance gives ample time to come to grips with the conditions, mentally as well as physically and technically.

International competition
Historically WOC has been the first-ever international competition for some of our orienteers.  Again this is not ideal for a sport where mental preparation is as important as physical preparation.  For one of our touring orienteers, France was their first international experience, and it was invaluable to do this in a “no pressure” pre WOC situation.

Things that are different to SA include:

  • use of the Sport Ident (different to the EMIT timing system used in SA);
  • long walks to the start areas;
  • long start boxes (and thus the need to consider mental preparation during this time);
  • control descriptions only being handed out in the start boxes;
  • hundreds of competitors with the implications that “new paths” can appear in the terrain, and more than ever you need to block out everyone around you;
  • TV and spectator controls, again bringing with it the need to block out everything else.

The future
To create champions of the future SA needs to be able to provide our Orienteers with world class preparation and training. The top orienteering teams visit a WOC area at least 3 times before WOC.  The preparation begins a year, sometimes even 2 years in advance.  Such preparation n is essential to ensure the orienteers are in the best physical, technical and mental form.  SA would do well to follow the example of the top medal winning nations.

Tania Wimberley

[ You can follow a blow-by-blow account of the groups tour at the Senior Squad Blog.]

SA JWOC Performance

South African Performance at the Junior World Orienteering Championships

In order to determine whether or not high performance initiatives are baring fruit it is necessary to track the performance of our elite orienteers on the world stage.

There are essentially two measures of performance that are recorded here. The first is the athlete’s time compared to the winning time.  This is normalised as a percentage of the winning time to enable comparison across different races.

The second measure is the athlete’s position in the race.  For comparison this is expressed as a percentage of the size of the field.

Since the sizes of fields have changed over time and because the quality of the field may change over time, the preferred measure to use to monitor performance improvement is the athlete’s time expressed as a percent of the winner’s time.

What neither of these measures accounts for is the technical difficulty of the terrain.  This is somewhat of a subjective assessment and is not readily quantified.  Hence this set of records ignores the relative technical difficulty of the terrain.

For each event type, a table of individual results is recorded.  This permits analysis of individual improvement.  The tables are followed by plots of performance, which are useful in assessing team performance.

Performances in JWOC Long

Men

Year Name Position Field Time Winner’s Time % of Winner’s Time Relative Position %
1996 Gary de Klerk 89 162 01:58:59 01:22:43 144% 54.9%
1996 Martin Terry 133 162 02:57:34 01:22:43 215% 82.1%
1996 Nicholas Mulder 137 162 03:08:15 01:22:43 228% 84.6%
1996 Mark Greeff DSQ 162
1997 Nicholas Mulder 143 159 01:52:22 01:00:51 185% 89.9%
1997 Andrew Havemann 147 159 02:01:36 01:00:51 200% 92.5%
1998 Nicholas Mulder 73 111 01:17:52 00:56:17 138% 65.8%
2000 Pieter Nieuveld 146 155 02:12:23 01:09:53 189% 94.2%
2006 Dylan Hemer 136 167 02:18:17 01:10:41 196% 81.4%
2006 Alex Pope 154 167 02:34:00 01:10:41 218% 92.2%
2008 Dylan Hemer 119 169 01:47:37 01:12:22 149% 70.4%
2008 Alex Pope 126 169 01:51:05 01:12:22 154% 74.6%
2009 Brad Lund 135 168 02:14:48 01:05:55 205% 80.4%
2010 Michael Crone 142 156 02:29:57 01:20:48 186% 91.0%
2010 Brad Lund 137 156 02:11:55 01:20:48 163% 87.8%
2010 JP Sissing 149 156 03:54:39 01:20:48 290% 95.5%

Women

Year Name Position Field Time Winner’s Time % of Winner’s Time Relative Position %
1996 Michele Mulder 95 110 02:46:26 01:06:24 250.7% 86%
1997 Michele Mulder 121 138 01:40:10 00:53:36 186.9% 88%
2000 Michele Mulder 129 146 01:43:49 00:59:43 173.8% 88%
2009 Sarah Pope 100 122 01:53:43 00:54:12 209.8% 82%
2009 Jessica Lund 101 122 01:54:14 00:54:12 210.8% 83%
2009 Zoe Brentano 112 122 02:15:59 00:54:12 250.9% 92%
2009 Jessica Hemer 113 122 02:25:52 00:54:12 269.1% 93%
2009 Salome van Hoepen 117 122 02:56:04 00:54:12 324.8% 96%
2009 Stephanie Courtnage 118 122 03:10:31 00:54:12 351.5% 97%
2010 Jessica Lund 114 122 02:18:30 01:01:55 223.7% 93%
2010 Sarah Pope 99 122 01:43:37 01:01:55 167.3% 81%
2010 Salome van Hoepen 108 122 01:49:42 01:01:55 177.2% 89%
2010 Zoe Brentano 113 122 02:05:18 01:01:55 202.4% 93%

The connecting lines track the improvement of an individual athlete.

In the case of the Women there is a clear improvement from 2009 to 2010.  In both years the same athletes participated.  The best performance in 2010 represents the best-ever performance by a woman in the JWOC Long event.

In the case of the Men there is also a clear improvement from 2009 to 2010.  The best performance for the Men was achieved by the athlete who also attended the previous year.  The best performance in 2010 is nearing the best-ever performance of a man in the JWOC Long event.

Performances in JWOC Short/ Middle (Heats)

Men

Year Name Position Field Time Winner’s Time % of Winner’s Time Relative Position %
1996 Martin Terry 120 165 00:45:33 00:29:05 157% 72.7%
1996 Gary de Klerk 146 165 00:54:07 00:29:05 186% 88.5%
1996 Nicholas Mulder 153 165 00:59:06 00:29:05 203% 92.7%
1996 Mark Greeff 160 165 01:04:49 00:29:05 223% 97.0%
2000 Pieter Nieuveld 41 52 00:35:31 00:25:54 137% 78.8%
2006 Alex Pope 46 57 00:34:42 00:20:17 171% 80.7%
2006 Dylan Hemer 49 56 00:42:28 00:20:26 208% 87.5%
2008 Alex Pope 38 58 00:37:36 00:27:04 139% 65.5%
2008 Dylan Hemer 48 58 00:44:56 00:25:55 173% 82.8%
2009 Brad Lund 55 58 00:47:21 00:26:17 180% 94.8%
2010 Mike Crone 52 53 00:36:14 00:21:38 167% 98.1%
2010 JP Sissing 53 53 00:49:13 00:21:00 234% 100.0%
2010 Brad Lund 42 52 00:30:53 00:21:43 142% 80.8%

Women

Year Name Position Field Time Winner’s Time % of Winner’s Time Relative Position %
1996 Michele Mulder 101 113 00:52:10 00:26:32 196.6% 89%
2000 Michele Mulder 36 49 00:30:49 00:24:19 126.7% 73%
2009 Salome van Hoepen 34 42 00:37:07 00:25:19 146.6% 81%
2009 Zoe Brentano 38 42 00:48:04 00:27:20 175.9% 90%
2009 Jessica Hemer 38 42 00:45:18 00:25:19 178.9% 90%
2009 Sarah Pope 35 40 00:45:24 00:23:53 190.1% 88%
2009 Jessica Lund 36 40 00:47:37 00:23:53 199.4% 90%
2009 Stephanie Courtnage 39 42 00:58:35 00:27:20 214.3% 93%
2010 Salome van Hoepen 36 42 00:34:57 00:23:20 149.8% 86%
2010 Jessica Lund 37 42 00:37:14 00:23:21 159.5% 88%
2010 Zoe Brentano 39 42 00:41:11 00:23:21 176.4% 93%
2010 Stephanie Courtnage 37 41 00:34:34 00:22:45 151.9% 90%
2010 Sarah Pope 39 41 00:38:58 00:22:45 171.3% 95%


The connecting lines track the improvement of an individual athlete.

In the case of the Women there is a clear overall improvement from 2009 to 2010, although the best performance of 2009 was not improved upon in 2010. In both years the same athletes participated. There is still some way to go to attain the best-ever performance for a woman in the JWOC Middle event, which was achieved in 2000.

In the case of the Men there is also a clear improvement from 2009 to 2010. The best performance for the Men was achieved by the athlete who also attended the previous year. The best performance in 2010 is nearing the best-ever performances of a man in the JWOC Middle event. These were achieved in 2000, closely followed by 2008.

The worst performance in 2010 was at a comparable level to historic performances for first-time participants at JWOC.

Performances in JWOC Sprint

Men

Year Name Position Field Time Winner’s Time % of Winner’s Time Relative Position %
2006 Dylan Hemer 130 162 00:15:38 00:11:45 133.0% 80.2%
2006 Alex Pope 136 162 00:15:59 00:11:45 136.0% 84.0%
2008 Dylan Hemer 121 173 00:16:48 00:13:21 125.8% 69.9%
2008 Alex Pope 130 173 00:17:14 00:13:21 129.1% 75.1%
2009 Brad Lund 143 169 00:20:40 00:14:43 140.4% 84.6%
2010 Michael Crone 109 153 00:16:30 00:13:04 126.3% 71.2%
2010 Brad Lund 137 153 00:18:40 00:13:04 142.9% 89.5%
2010 JP Sissing 142 153 00:20:12 00:13:04 154.6% 92.8%

Women

Year Name Position Field Time Winner’s Time % of Winner’s Time Relative Position %
2009 Stephanie Courtnage 82 120 00:17:31 00:13:34 129.1% 68%
2009 Salome van Hoepen 84 120 00:17:49 00:13:34 131.3% 70%
2009 Jessica Lund 93 120 00:18:46 00:13:34 138.3% 78%
2009 Sarah Pope 97 120 00:19:25 00:13:34 143.1% 81%
2009 Jessica Hemer 108 120 00:22:27 00:13:34 165.5% 90%
2009 Zoe Brentano 110 120 00:23:36 00:13:34 174.0% 92%
2010 Stephanie Courtnage 63 118 00:16:58 00:13:36 124.8% 53%
2010 Jessica Lund 92 118 00:19:01 00:13:36 139.8% 78%
2010 Sarah Pope 101 118 00:20:33 00:13:36 151.1% 86%
2010 Salome van Hoepen 103 118 00:21:03 00:13:36 154.8% 87%
2010 Zoe Brentano 104 118 00:21:40 00:13:36 159.3% 88%

The connecting lines track the improvement of an individual athlete.

In the case of the Women there is a clear overall improvement from 2009 to 2010, with a new best-ever performance for a woman in the JWOC Sprint event.  In both years the same athletes participated.

In the case of the Men there is also a clear improvement from 2009 to 2010.  The best performance for the Men was achieved by an athlete who attended JWOC for the first time in 2010.  The best performance in 2010 was fractionally the best-ever performance of a man in the JWOC Sprint event, previously achieved in 2008.

SA Performance at World Games 2009

Nicholas Mulder and Tania Wimberley represented South Africa at the World Games in Kaohsiung, Taiwan from 16-26 July 2009.  The Orienteering at the World Games consisted of a Sprint and Middle distance event.  The results of our runners in these events are included at the end of this post.  It is worth analysing the results of our athlete’s performances against the targets set in the SAOF’s 2010 high performance strategic plan (PDF doc 141KB).  In terms of our athletes’ finishing times as a percentage of the winners, they performed as follows:

Sprint Middle Sprint Middle
Men 132% 135% 115% 130%
Ladies 139% 142.5% 150% 150%
World Games % of winner times HP plan targets

Also included in this table are the targets set in the 2010 high performance strategic plan (PDF doc 141KB).   Nicholas had a good showing in the Middle distance event, coming close to the target level.  Tania’s performance exceeded the targets set and, in both cases, her performances amount to the best-ever performances by a South African woman at a world championship level event.  Tania’s performances can be attributed to a number of factors:

  1. SASCOC intervention through access to the High Performance Centre and access to a high performance training program
  2. It was her second international event (after WOC 2006), reflecting the benefit of experience.
  3. The terrain was less technical, i.e. more like what we’re used to.

What this does show is that focus, commitment and access to elite-level physical assessment and training programmes are hugely important if we wish to raise the level of performance of our elite orienteers in the international arena.

Sprint Distance (36 Competitors)
Women (Length: 2.9 km, Climb: 30 m, 23 controls)
1 Minna Kauppi FIN 14:17,7
2 Hanny Allston AUS 14:40,0
3 Elise Egseth NOR 14:53,8
31 Tania Wimberley RSA 20:20,0
Men (Length: 3.2 km, Climb: 30 m, 24 controls)
1 Andrey Khramov RUS 13:11,2
2 Daniel Hubmann SUI 13:12,8
3 Tero Föhr FIN 13:46,5
34 Nicholas Mulder RSA 17:24,6
Middle Distance (36 Competitors)
Women (Length: 4.7 km, Climb: 140 m, 23 controls)
1 Hanny Allston AUS 27:01
2 Minna Kauppi FIN 28:17
3 Linnea Gustafsson SWE 28:44
31 Tania Wimberley RSA 38:30
Men (Length: 5.6 km, Climb: 155 m, 24 controls)
1 Daniel Hubmann SUI 27:43
2 Dmitriy Tsvetkov RUS 28:17
3 Andrey Khramov RUS 28:52
31 Nicholas Mulder RSA 37:23